Access data in RMarkdown
The data generated in Cecelia can be further analysed in R-Markdown for custom quantification or visualisation. The main principle is that the generated populations can be loaded as data-table which can be used for various functions. Here we make use of the results generated in Live image.
Live cell imaging
We need to activate the renv environment to use all packages. Sys.setenv(KMP_DUPLICATE_LIB_OK = “TRUE”) must be added before loading anything as R can otherwise crash. See Github issue for details if required.
 1# set path to cecelia
 2PATH_TO_CCIA <- "REPLACE/WITH/YOUR/PATH/TO/CECELIA"
 3
 4# load package environment
 5setwd(PATH_TO_CCIA)
 6renv::load()
 7
 8# load cecelia
 9Sys.setenv(KMP_DUPLICATE_LIB_OK = "TRUE")
10library(cecelia)
11cciaUse(PATH_TO_CCIA)
12
13# for plotting and general data processing
14library(ggplot2)
15library(tidyverse)
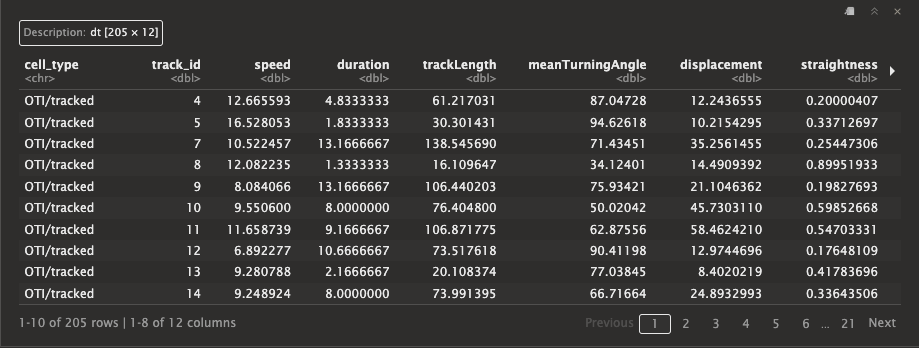
We can initialise the object with initCciaObject. Then we can get a list of the tracked populations with the popPaths function of the cciaObj. Tracked populations are a filtered population, which is why we have to set includeFiltered = TRUE when retrieving the population data-table.
 1# set project parameters
 2pID <- "REPLACE_WITH_PROJECT_ID" # this ID is found in the app 'Settings > unique ID (uID)'
 3versionID <- 1
 4
 5# init ccia object
 6cciaObj <- initCciaObject(
 7  pID = pID, uID = "REPLACE_WITH_IMAGE_ID", versionID = versionID, initReactivity = FALSE # Tcells
 8)
 9
10pops <- unname(unlist(cciaObj$popPaths(
11  popType = "live", filteredOnly = TRUE, filterMeasures = c("track_id"))))
12
13popDT <- cciaObj$popDT("live", pops = c(pops), includeFiltered = TRUE)
14popDT

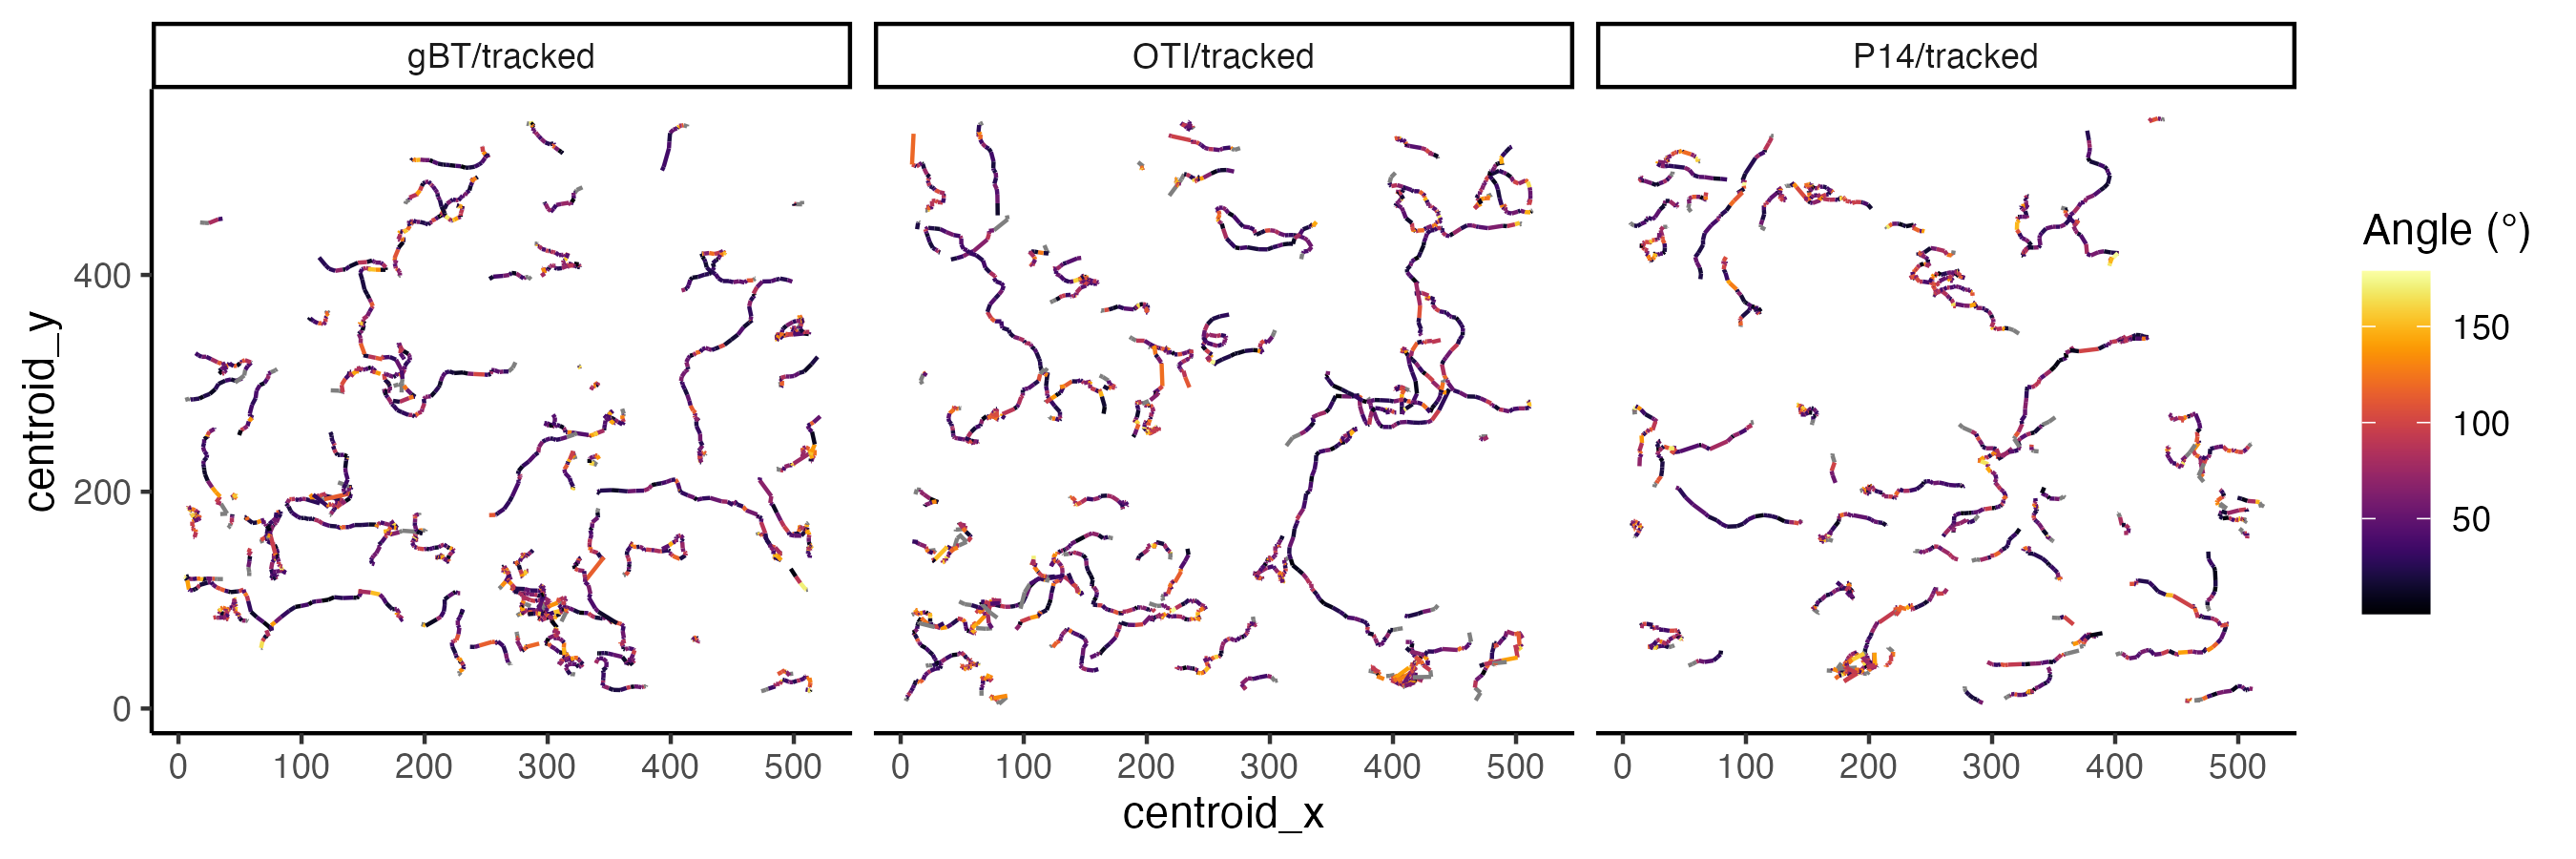
1# plot out tracks
2ggplot(popDT, aes(centroid_x, centroid_y, group = track_id,
3                  colour = pracma::rad2deg(live.cell.angle))) +
4  theme_classic() +
5  geom_path() +
6  facet_grid(.~pop) +
7  viridis::scale_colour_viridis(option = "inferno", name = "Angle (°)")
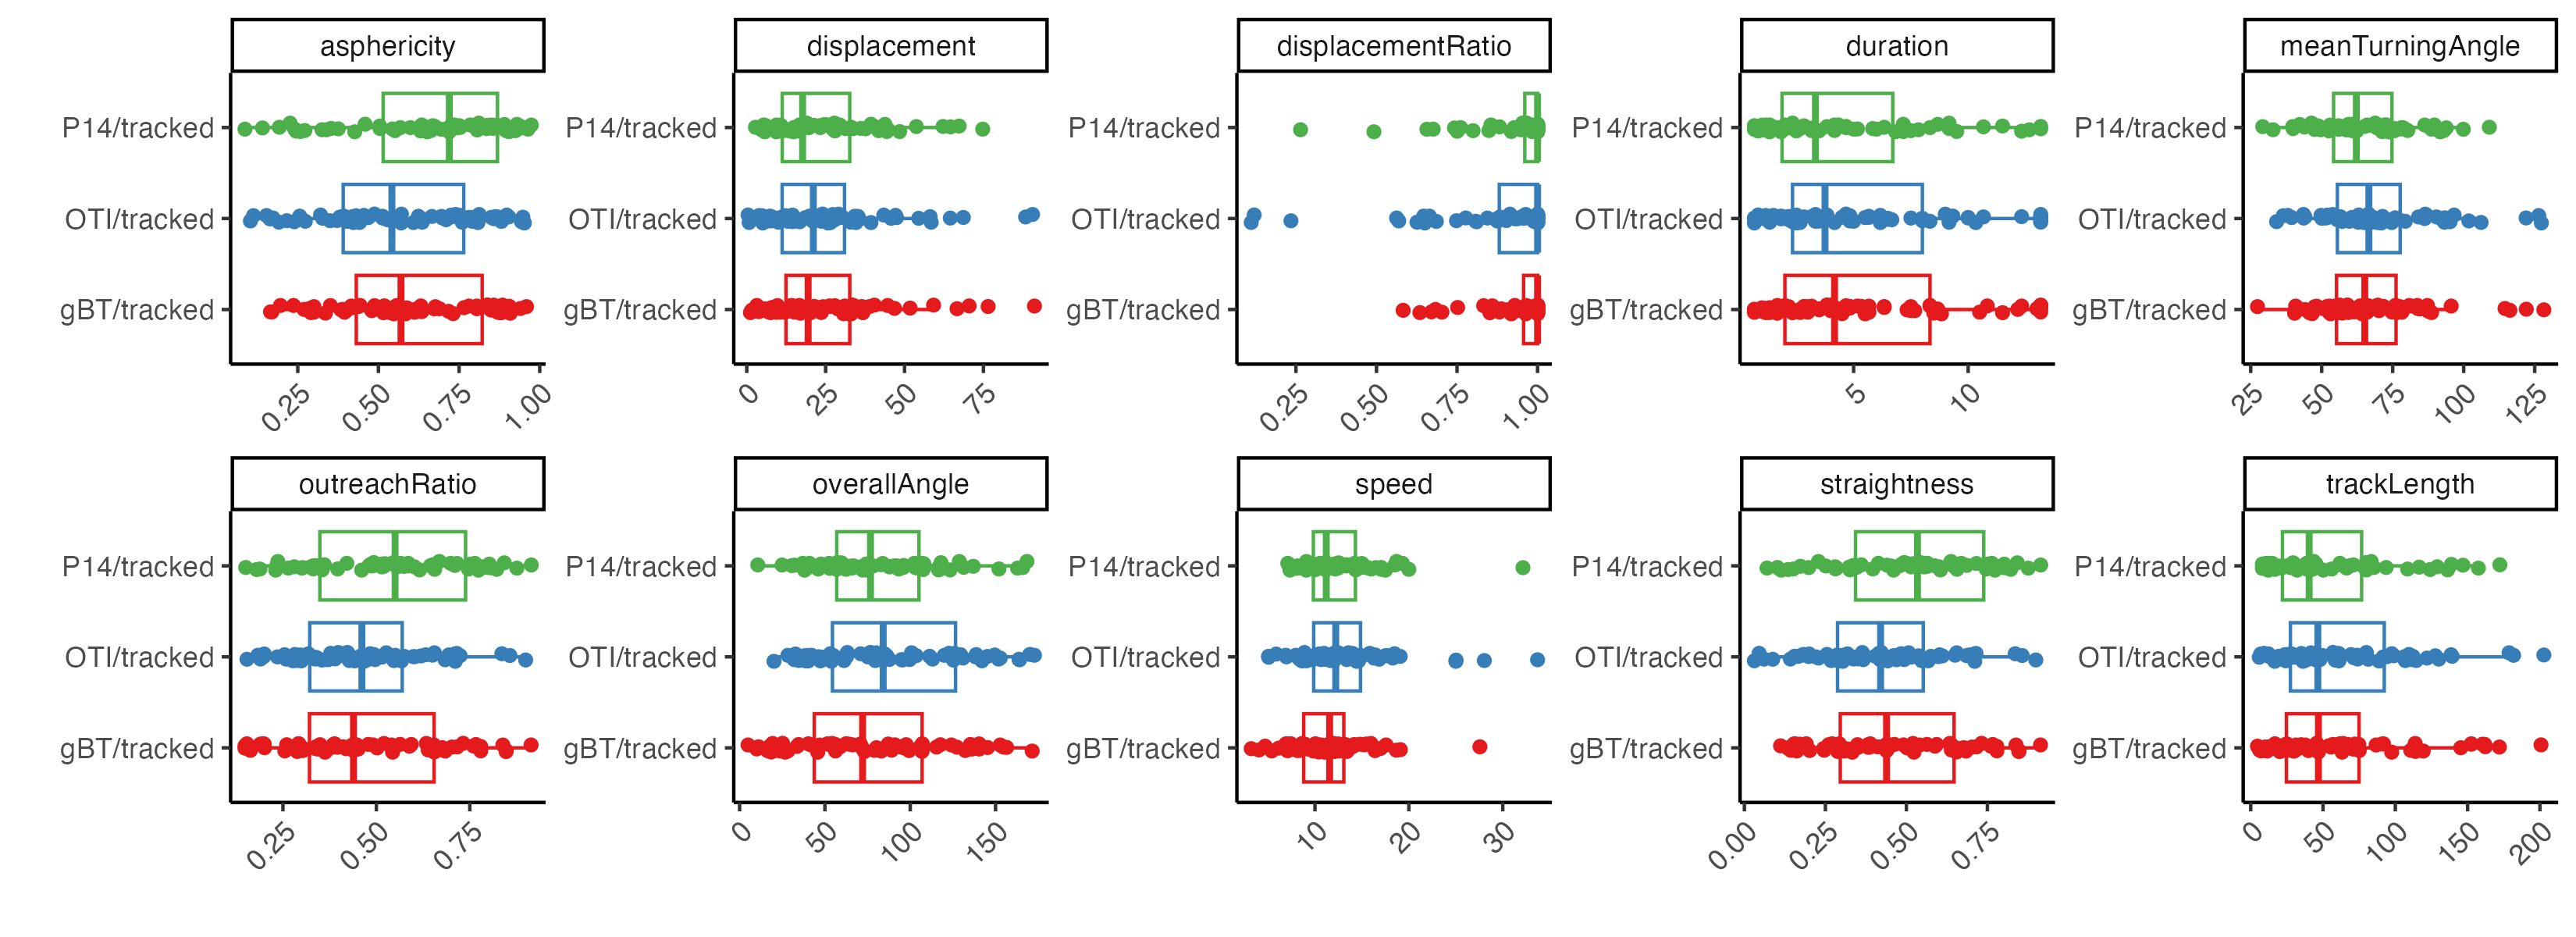
Next we can plot out different track measurements for the individual populations.
1# get tracks measurements for each population
2tracksInfo <- cciaObj$tracksMeasures(pops)
3tracksInfo
 1# get columns for plotting
 2colsToPivot <- colnames(tracksInfo)
 3colsToPivot <- colsToPivot[!colsToPivot %in% c("cell_type", "track_id")]
 4
 5# pivot longer
 6datToPlot <- tracksInfo %>%
 7  pivot_longer(cols = colsToPivot,
 8               names_to = "measure", values_to = "value")
 9
10# plot out
11ggplot(datToPlot, aes(cell_type, value, color = cell_type)) +
12  theme_classic() +
13  geom_boxplot(outlier.alpha = 0) +
14  geom_jitter(position = position_jitterdodge(jitter.width = 0.10)) +
15  facet_wrap(.~measure, scales = "free", nrow = 2) +
16  theme(
17    legend.position = "none",
18    axis.text.x = element_text(angle = 45, hjust = 1, vjust = 1)
19    ) +
20  scale_color_brewer(palette = "Set1") +
21  coord_flip() + xlab("") + ylab("")